Customize a map with Powerpoint or Impress
In this tutorial, we will learn a quick and easy way to edit a map with colors, text, and a legend.
In order to follow the practical steps of this tutorial, we provide you with an example file to download below:
Download the Powerpoint map of United States of America for Office Powerpoint.
Download the Powerpoint map of United States of America for LibreOffice Impress.
How to color your map, zone by zone?
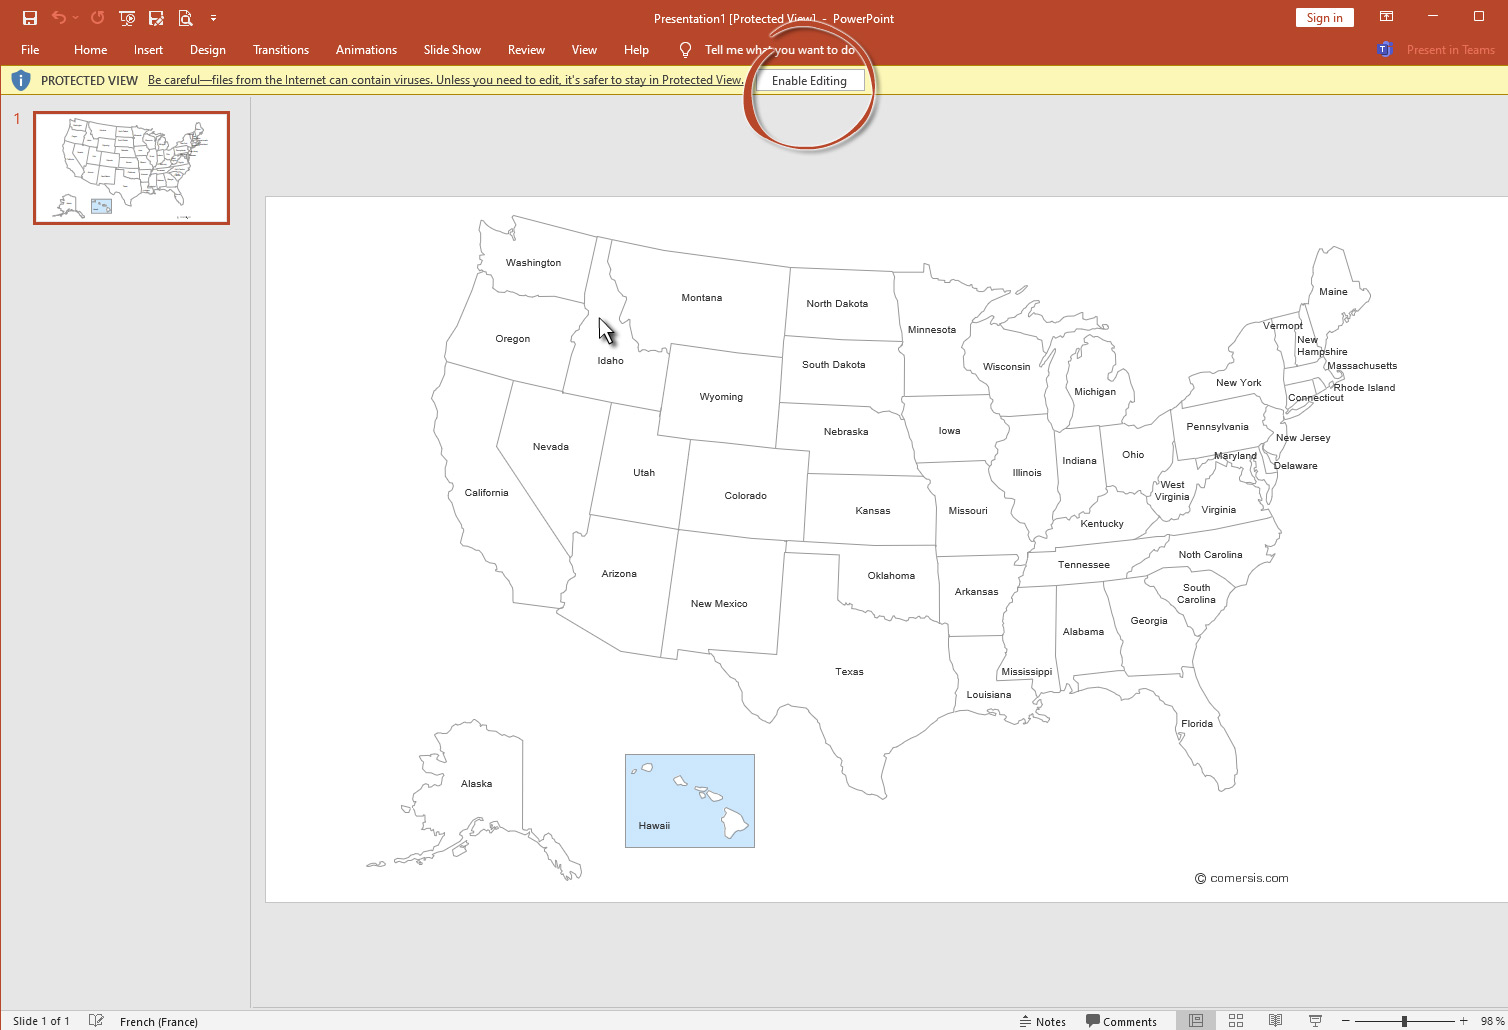
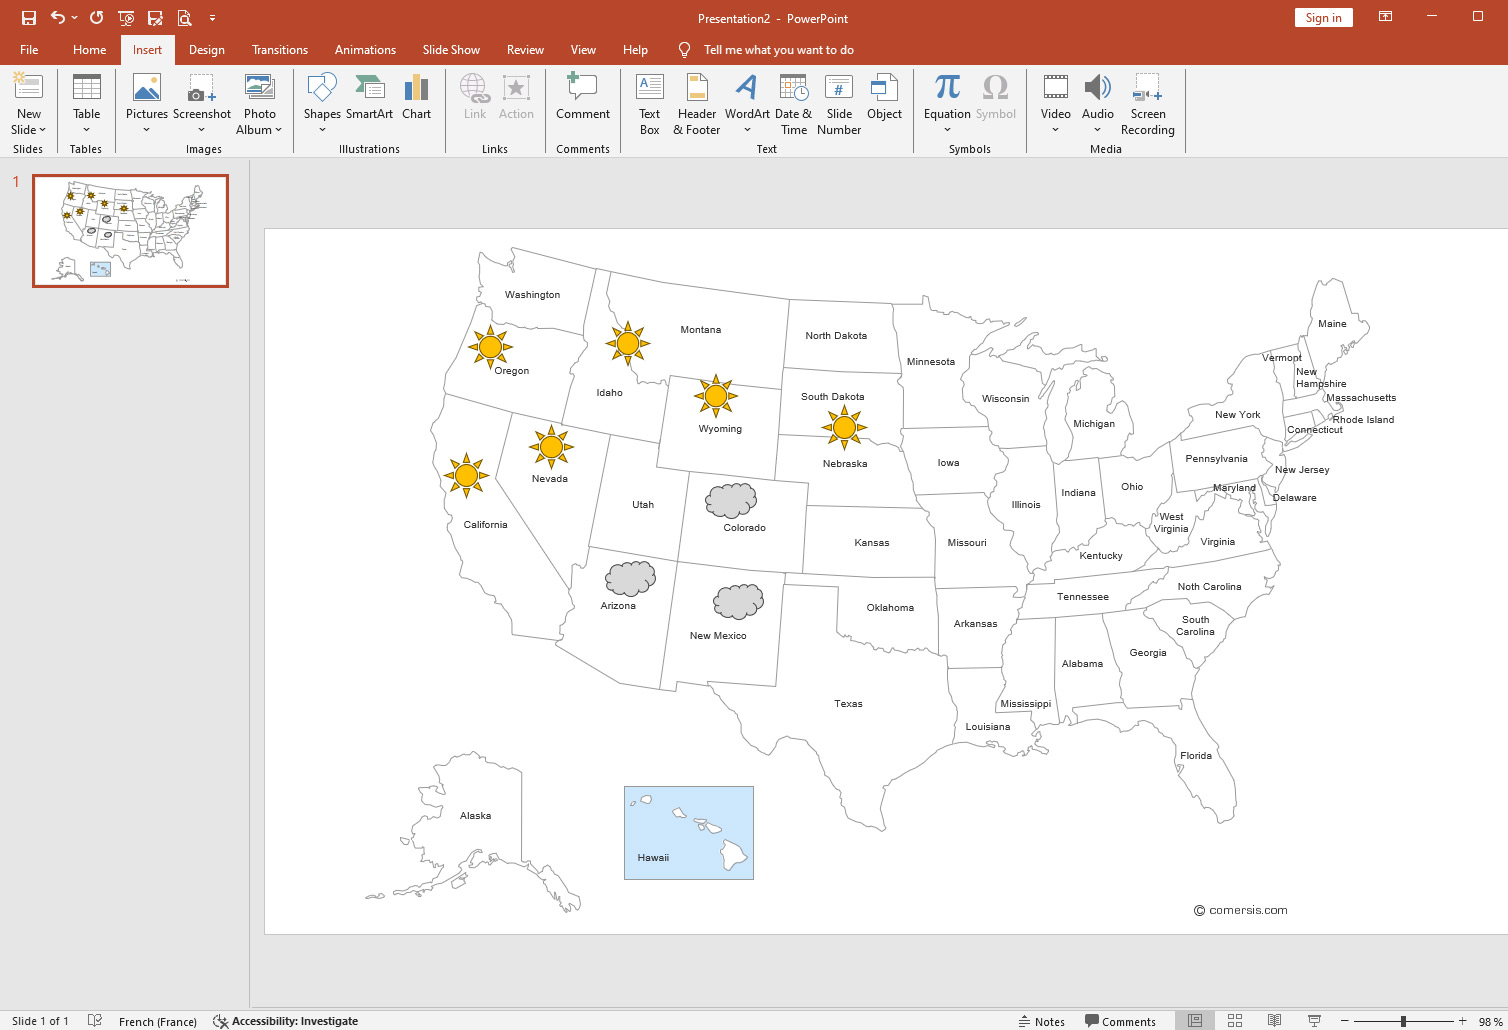
Open the example file downloaded above: A map of USA with the named states will open, where all the states (which we will call "areas") are white.
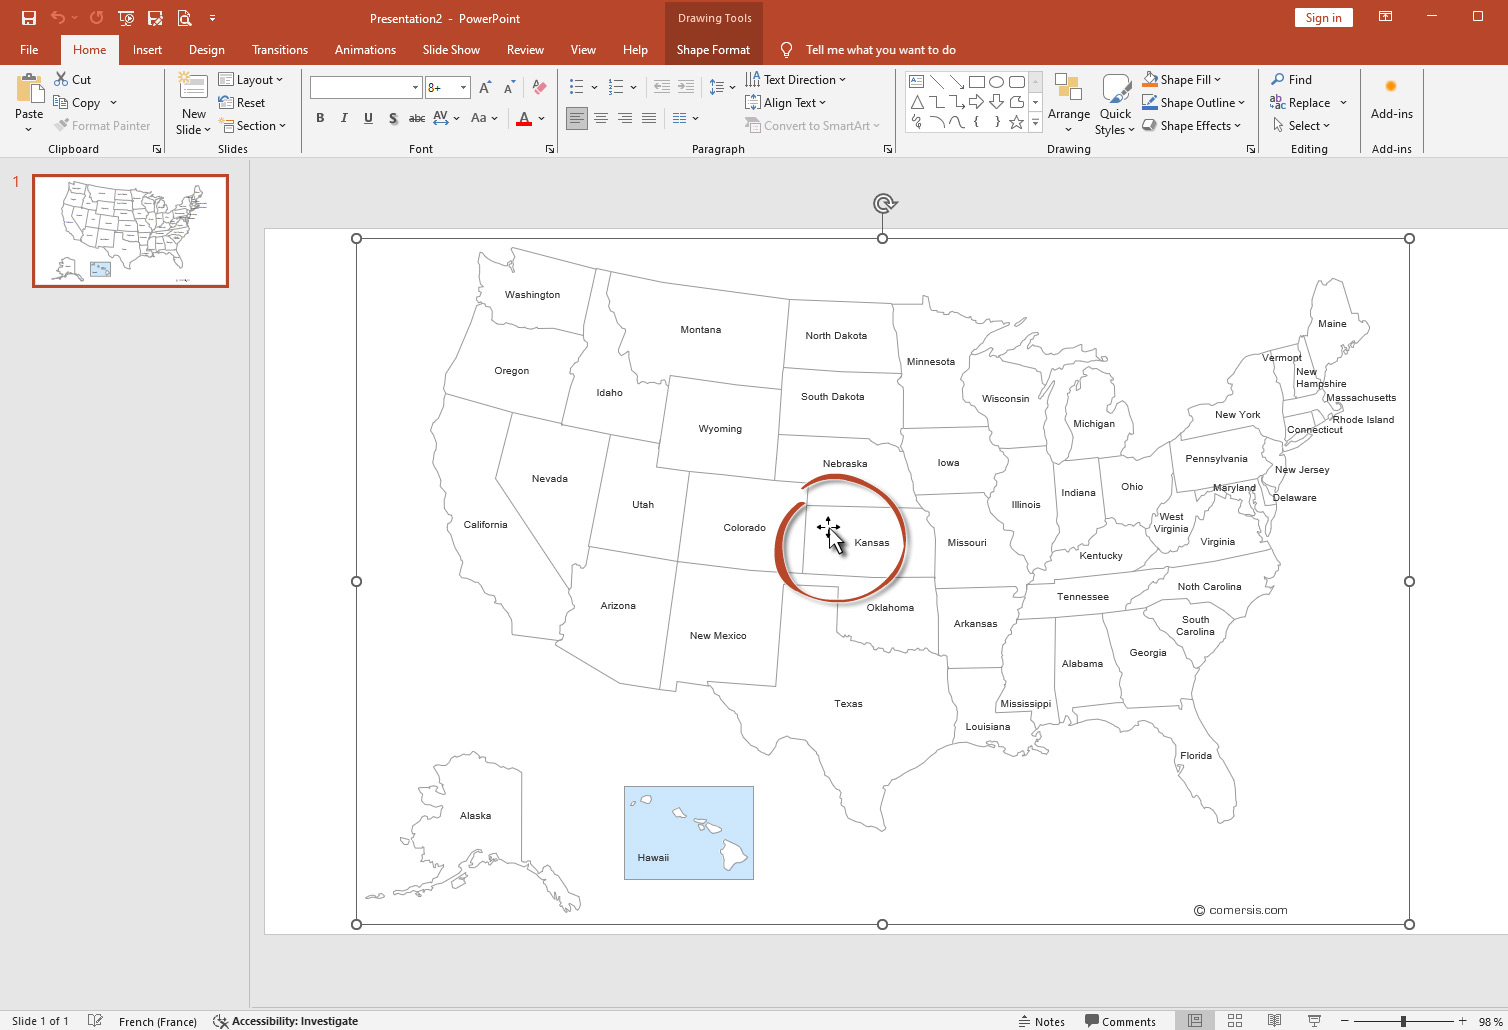
To start your edition, click on the map once, a selection frame appears all around it. This first frame, because there will be others, allows you to resize, move and copy / paste the entire drawing. see fig. 2 & fig. 3
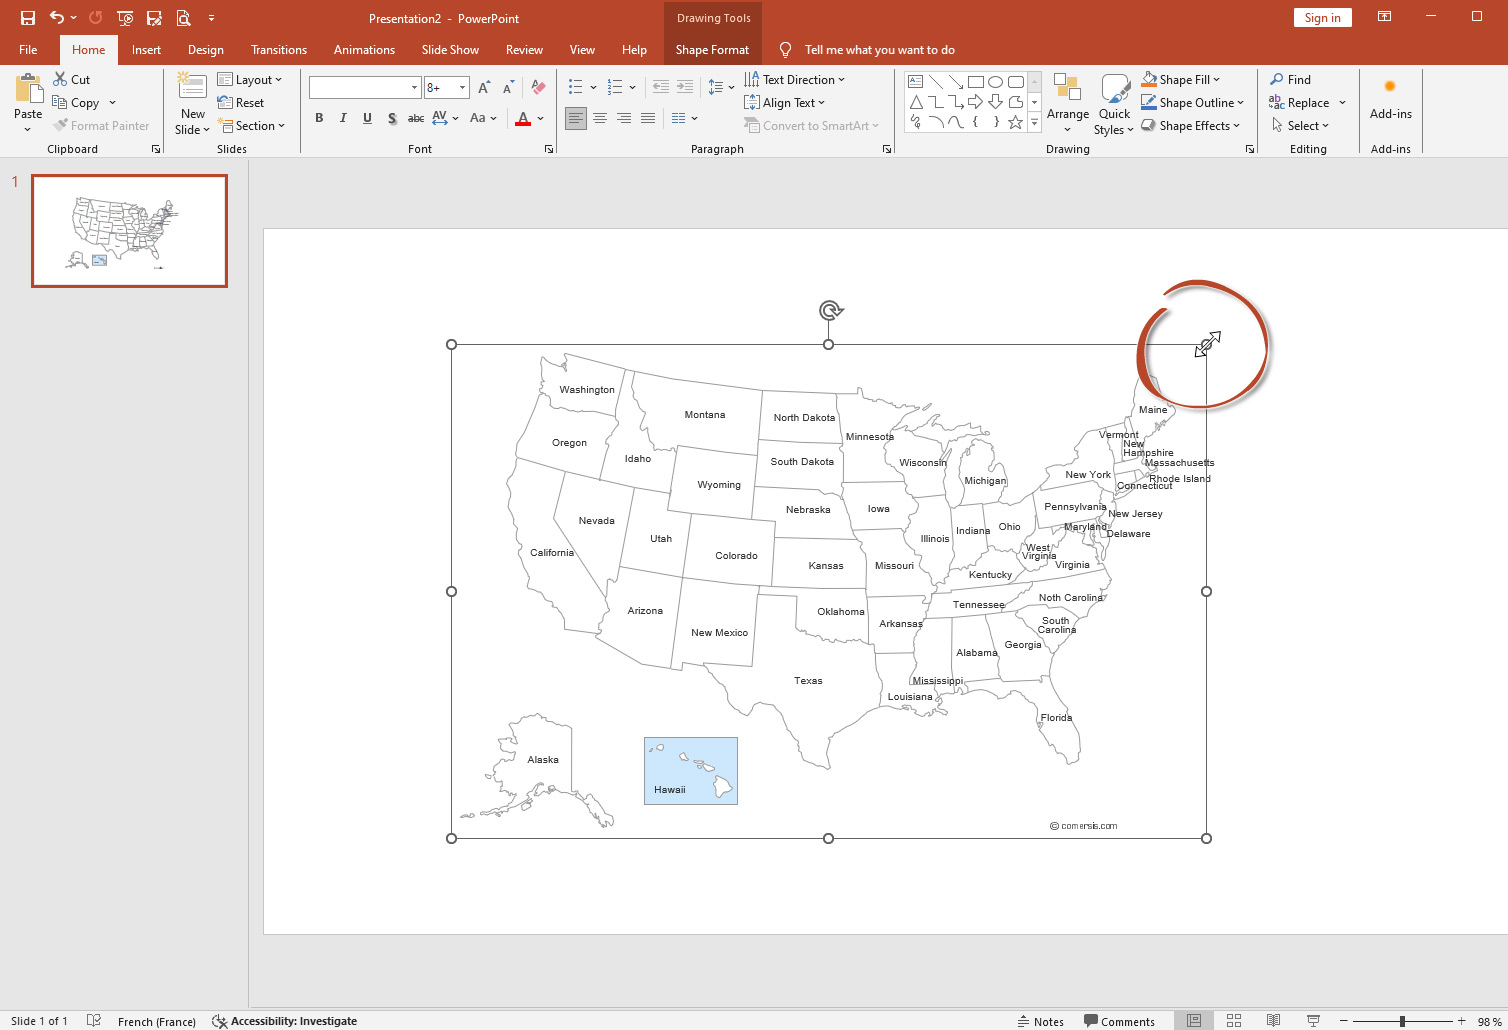
To resize the map, place your mouse on one of the points at the corners of the frame. Click on a point and move your mouse until you get the desired dimension. The height-width proportions will be preserved because this resizing is homothetic.
Then click a second time on a state (area), a second frame appears, this time surrounding only the zone.
While keeping your mouse over this second selection, click with the right mouse button to open
the contextual modification menu. (fig. 4)
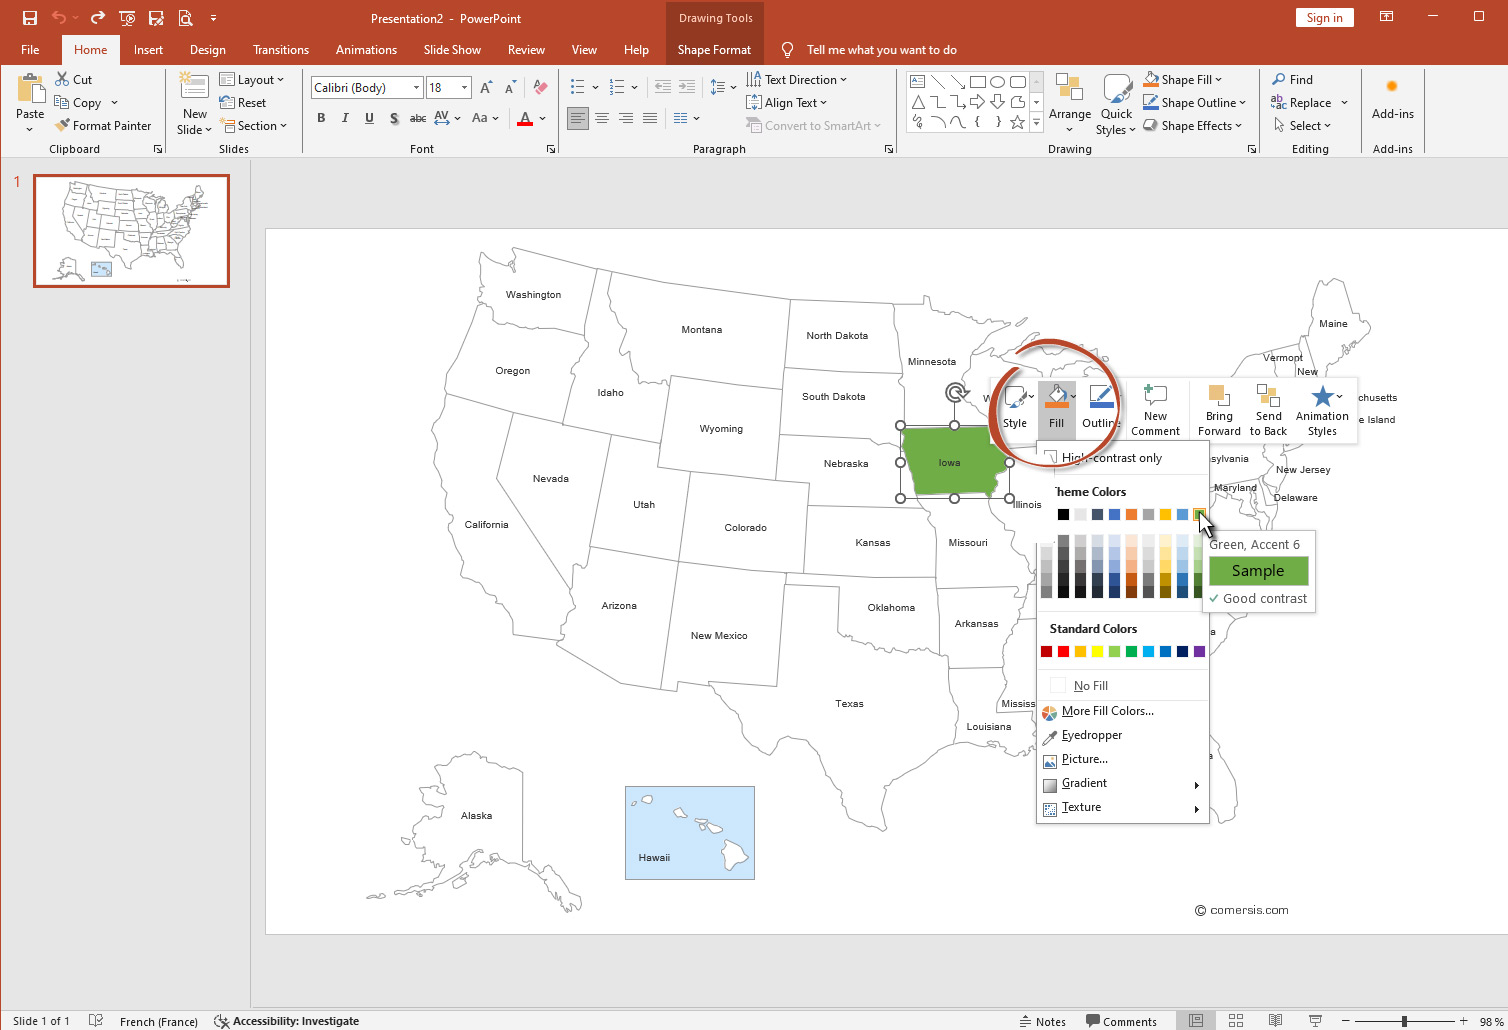
The context menu offers you a multitude of possibilities: style, fill color, outlines, comments, effects... We will keep it simple and only apply one fill color here. Choose a color by clicking on 'fill'; there you go, it's done.
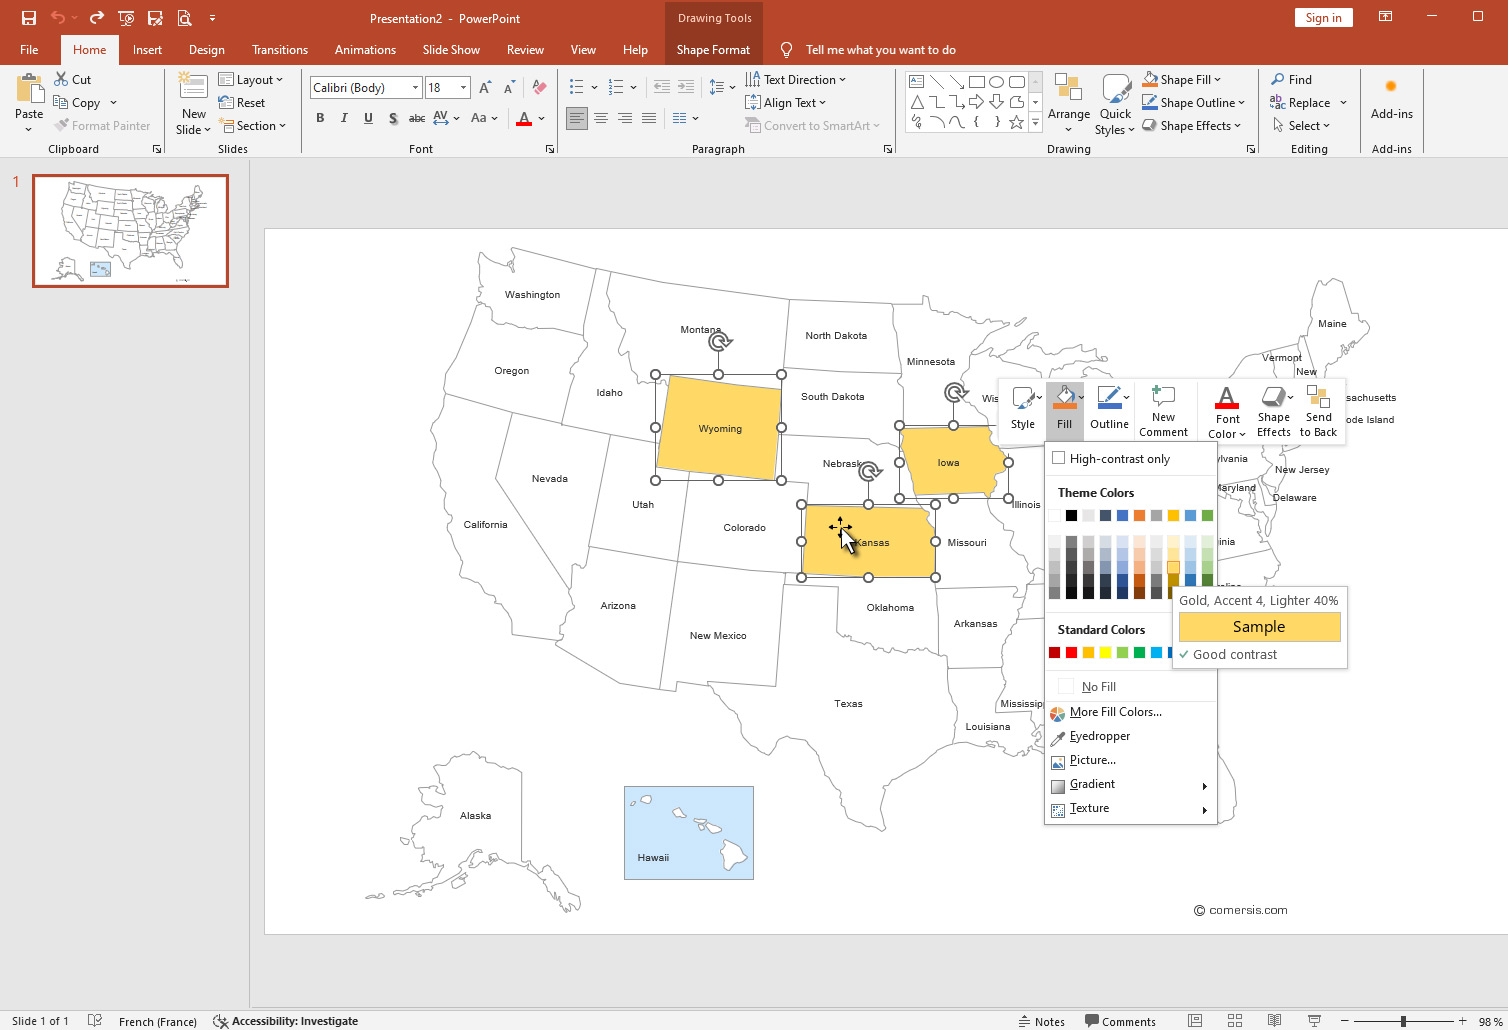
How to select several areas at the same time?
If you want to color several states (areas) the same color, without clicking them one by one, it's very simple:
Hold down the 'Control' key on your keyboard ('Ctrl' key for Windows | 'Control' or 'Ctrl' key for Mac) and click on the desired areas. This is called a hyper selection (fig. 5).
Once all these areas are framed, choose a color, a style or whatever you want.
Add text to your Powerpoint presentation.
To create a legend on your map, a title or place comments, click on the "insert" tab of the Powerpoint menu and then select "Text box".
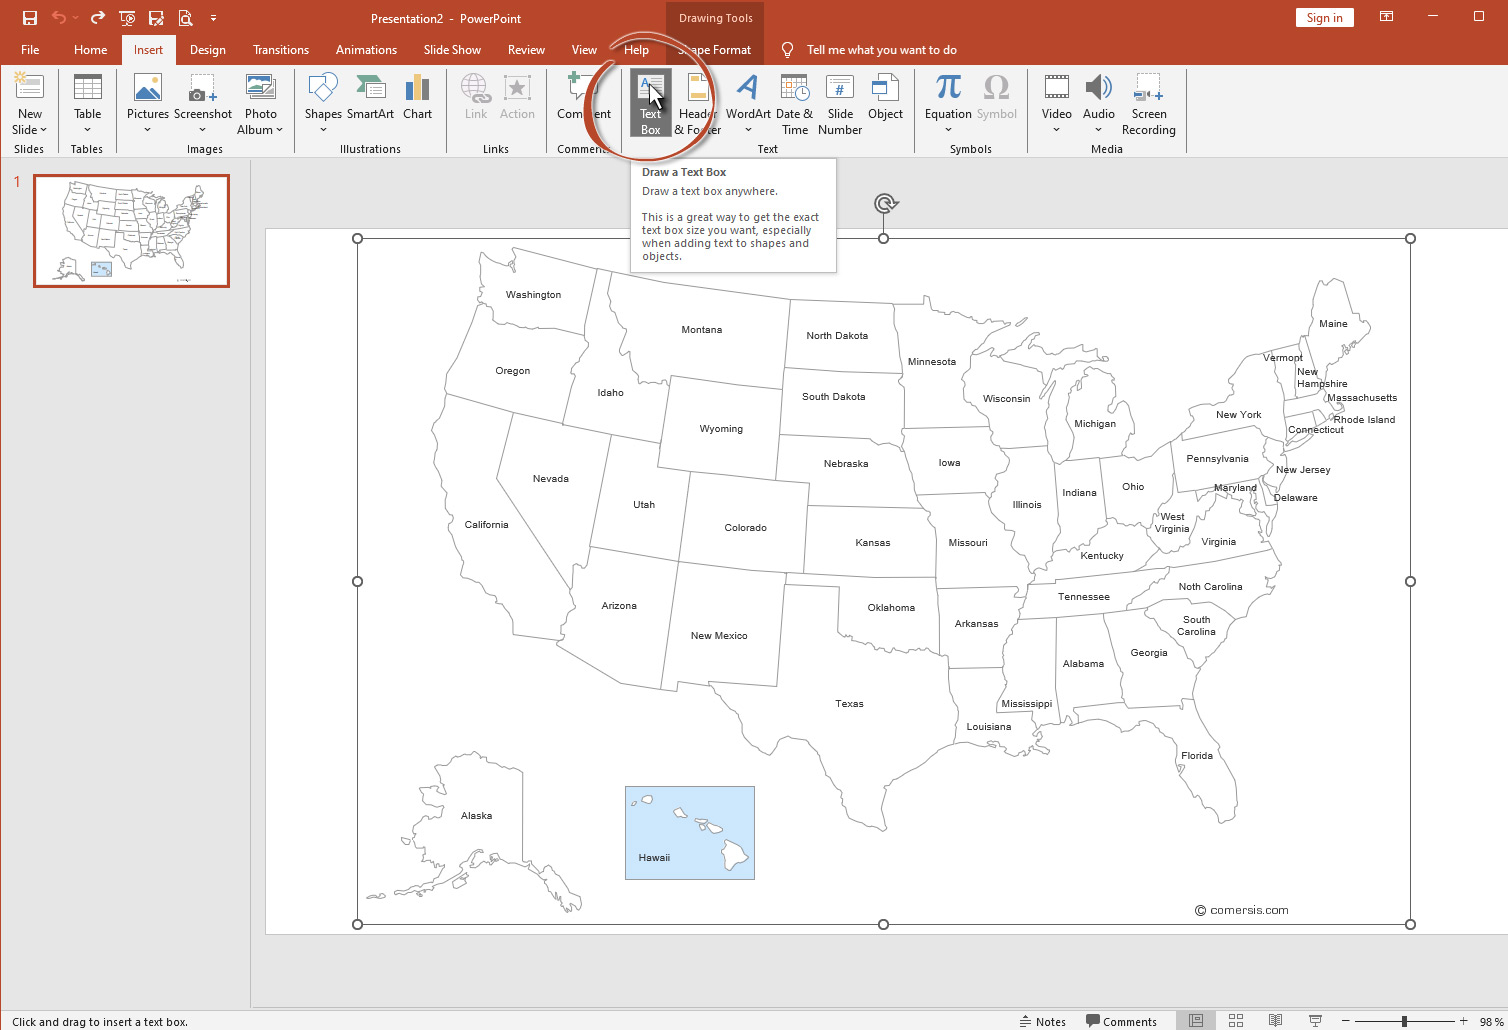
You will notice that your mouse cursor has changed and turned into a symbol that looks like a sword.
With this cursor, you will be able to draw a rectangle or a square by holding down the left button of your mouse.
Don't try to draw a perfect square from the beginning, you can modify it, move it and resize it later.
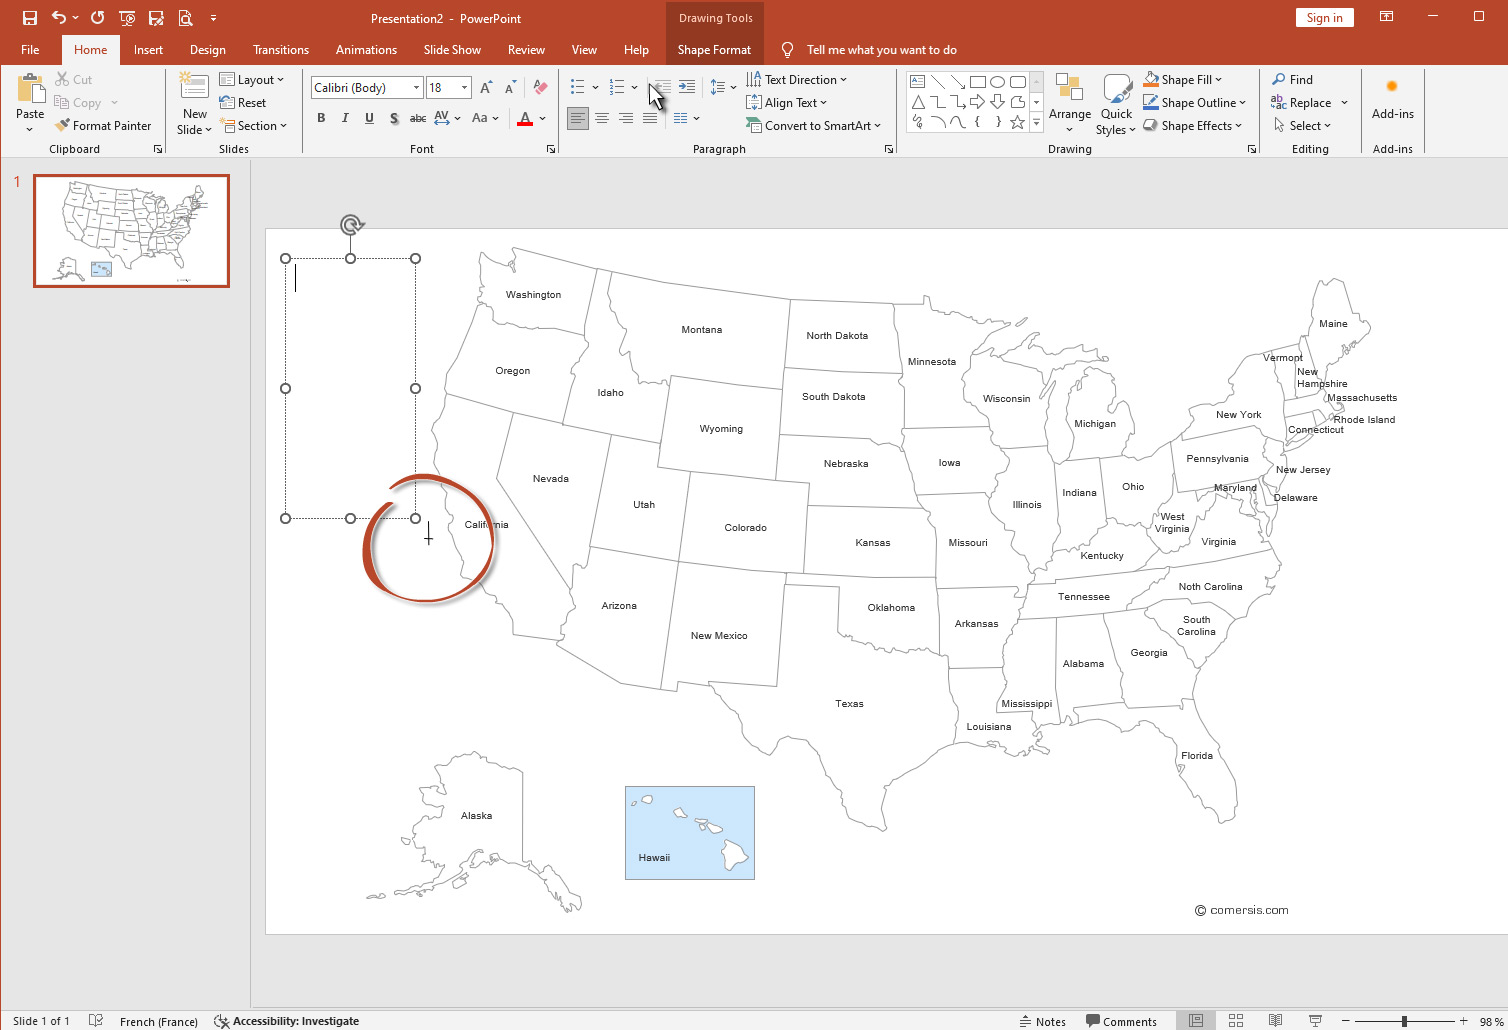
You can then type your text inside your square or rectangle, as in a standard text editor such as Notepad, Word or Write.
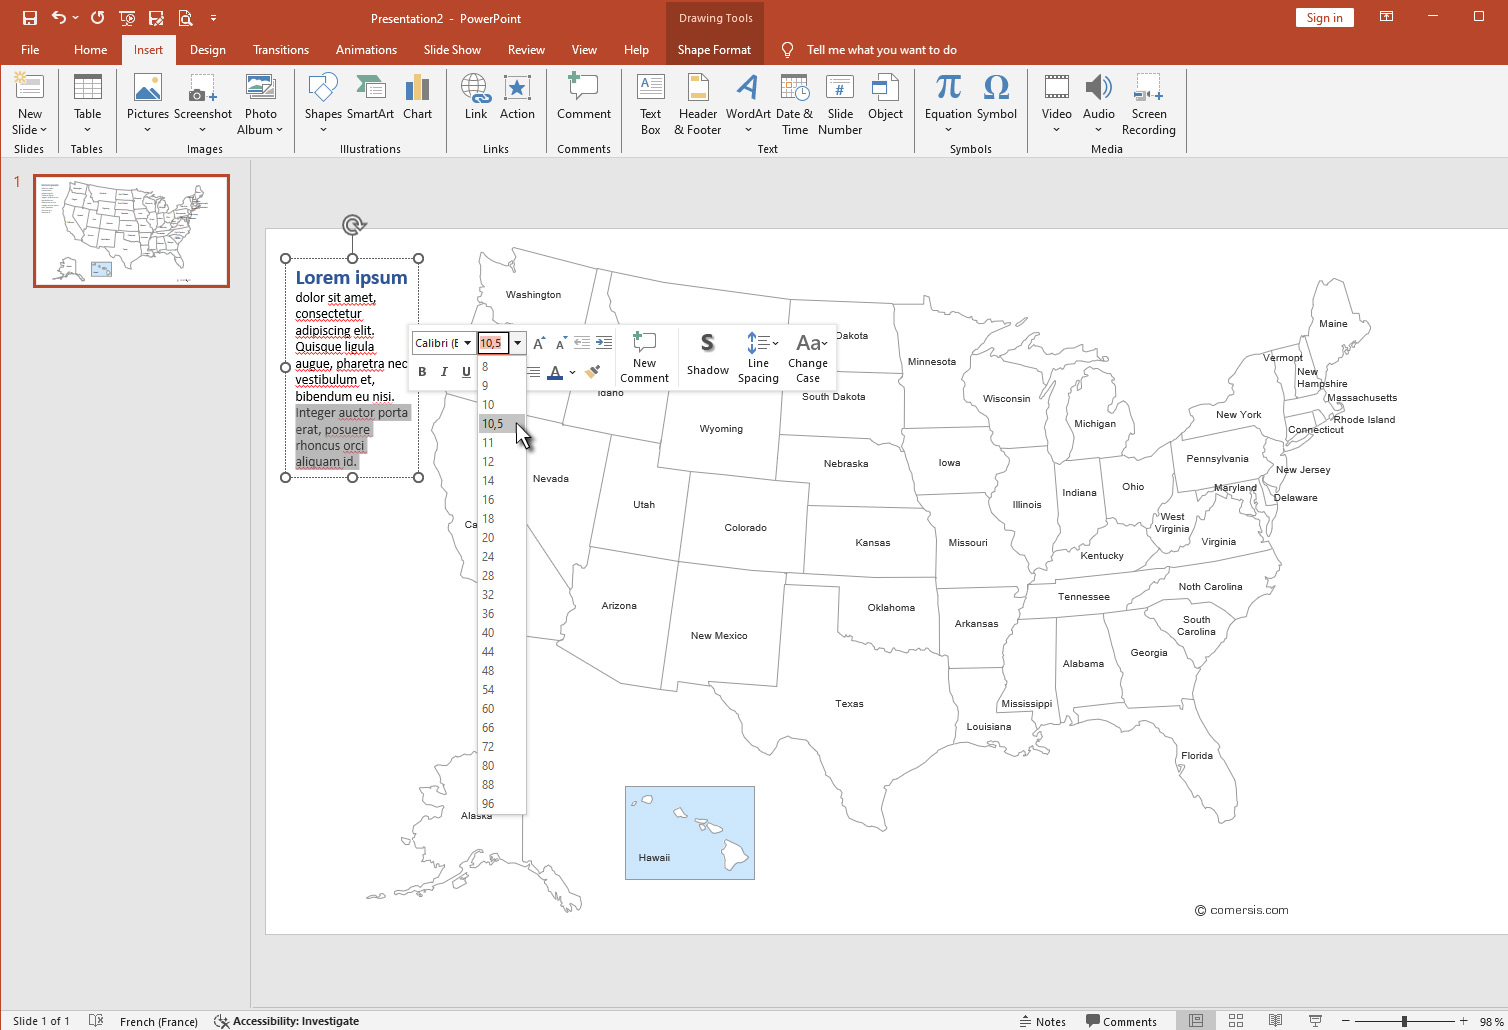
You will notice that a selection frame surrounds your text box; this frame allows you to move and resize it as for the map (see Figure 2 and 3). Your text will automatically adjust inside it.
Add shapes and symbols to the map.
We previously saw how to color the map, now we will add "shapes" to locate places or describe trends.
We will start by using the graphic shapes available in Powerpoint. Click on the "insert" tab of the Powerpoint menu and then select "Shapes". A menu opens and offers a library of various symbols.
For this exercise, I will choose the small sun in the "Basic Shapes" section.
Click on the shape of your choice, your mouse cursor will turn into a cross, move over the map and, as for the text box, hold down the left mouse button and enlarge your shape by moving your mouse slightly.
Use the "Shape Styles" menu or the "Fill" menu to change the color of your symbol. Here again, a selection frame surrounds your shape and allows you to move and resize it.
Once your icon is sized and colored, you can copy/paste it to other places on the map.
What format should I save my map in to print it?
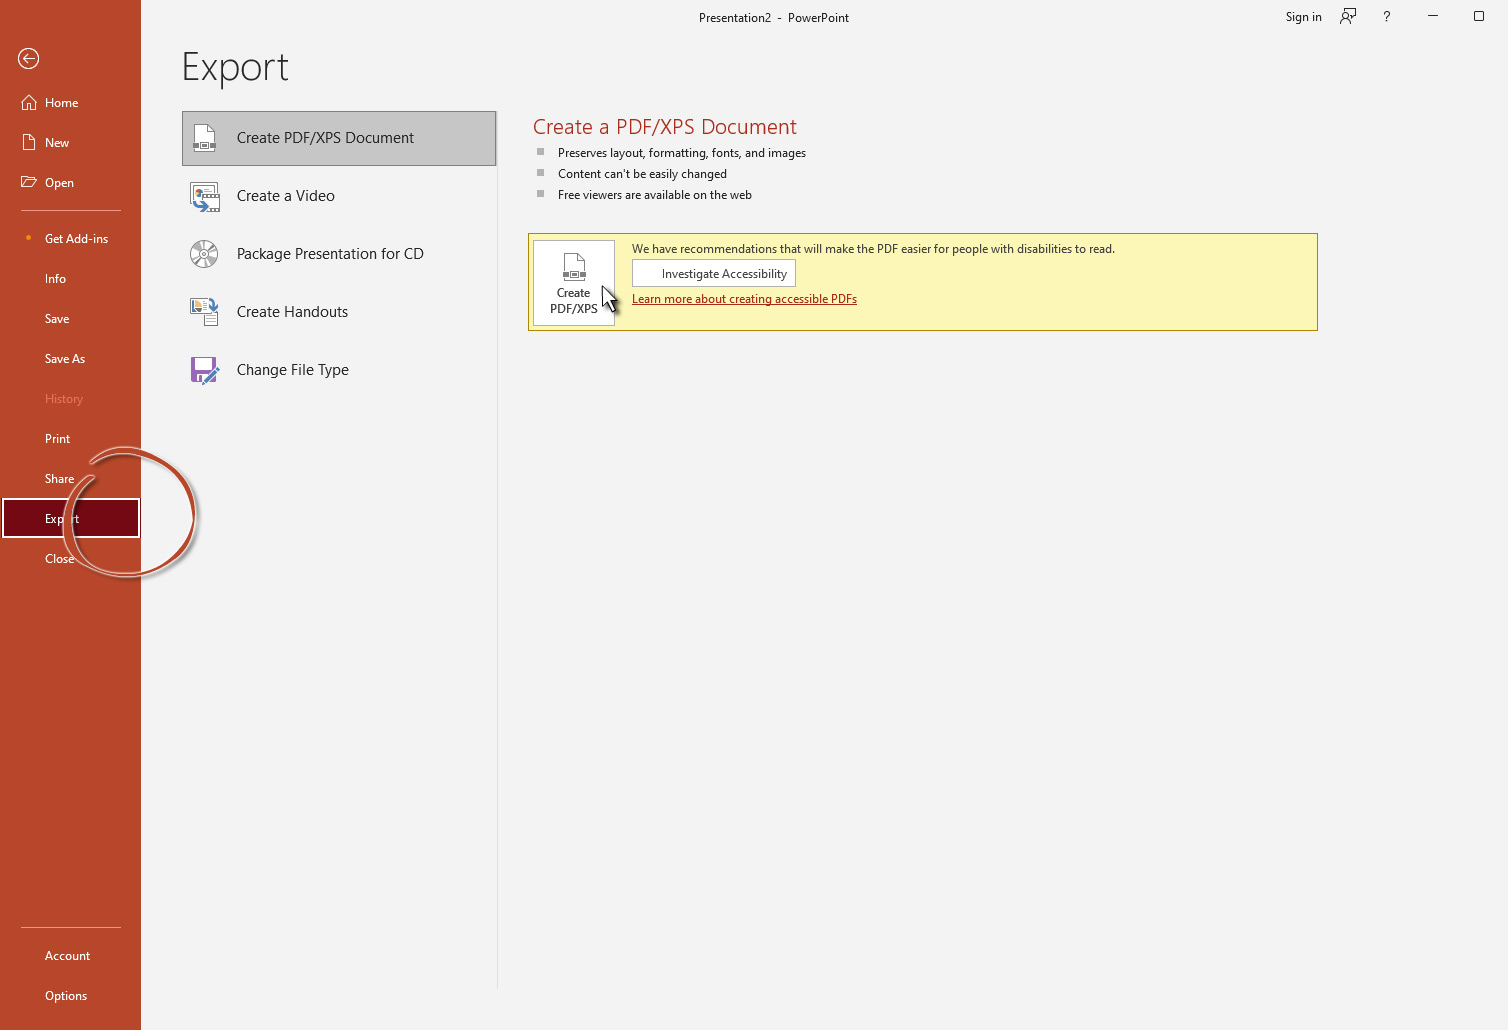
We recommend that you always choose a vector print format for your maps; in fact, this format does not contain any pixels and can be printed in very large dimensions. What are the vector saving formats on Powerpoint? First of all, the most used format in the world: PDF. Portable Document Format.
To save your map as a PDF, click 'File' -> 'Export' -> Create PDF/XPF.
Once the document is saved, open the PDF and zoom in as much as possible to understand the benefit of vector.
article updated on june 15, 2026
Related articles